Category: Articles

In the World of AVMs, Confidence Isn’t Overrated

Hit Rate is a key metric that AVM users care about. After all, if the AVM doesn’t provide a valuation, what’s the point? But savvy users understand that not all hits are created equal. In fact, they might be better off without some of those “hits.”

Every AVM builder provides a “confidence score” along with each valuation. Users often don’t know how much confidence to put in the confidence score, so we did some analysis to clarify just how much confidence is warranted.

In the first quarter of 2020, we grouped hundreds of thousands of AVM valuations from five AVMs by their confidence score ranges. For convenience’s sake, we grouped them into “high,” “medium,” “low” and “fuhgeddaboutit” (aka, “not rated”).[1] And, we analyzed the AVM’s performance against benchmarks in the same time periods. What we found won’t surprise anyone at first glance:

  • Better confidence scores were highly correlated with better AVM performance.
  • The lower two tiers were not even worth using.
  • The majority of valuations are in the top one or two tiers.

However, consider that unsophisticated users might simply use a valuation returned by an AVM regardless of the confidence score. One rationale is that any value estimate is better than nothing, and this is the valuation that is available. Other users may not know how seriously to take the “confidence score;” they may figure that the AVM supplier is simply hedging a bit more on this valuation.[2]

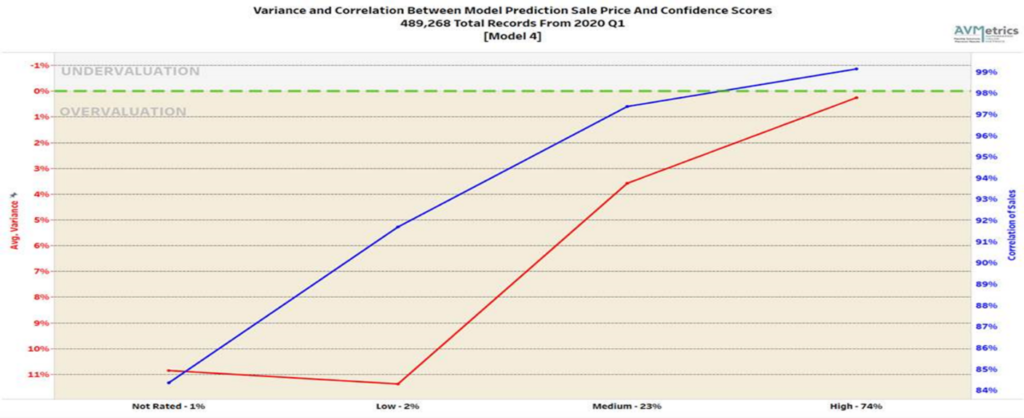
Figure 1 shows the correlation for Model #4 in our test between the predicted price and the actual sales price for each group of model-supplied confidence scores. As you can see, as the confidence score goes up so does the correlation[3] of the model and the accuracy of the prediction as evidenced by the drop in the Average Variance.

Figure 1 Variance and correlation between model prediction and sales price, grouped by confidence scores

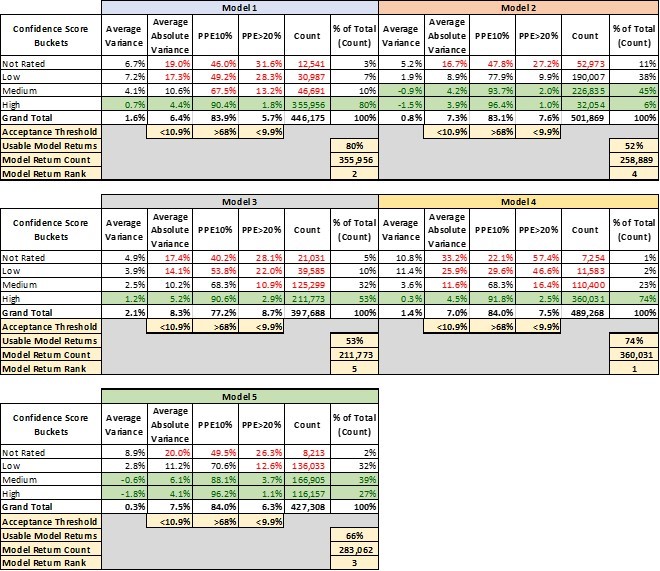
Table 1 lays out 4 key performance metrics for AVMs. They demonstrate markedly different performance for different confidence score buckets. For example, the “high” confidence score bucket for Model 1 performs significantly better in every metric than the other buckets, and what’s more that confidence bucket makes up 80% of the AVM valuations returned by Model 1.

Table 1 Q1 2020 performance of 5 actual commercial grade AVMs measured against benchmarks
  • Avg Variance [4] of 0.7% shows valuations that center very near the benchmarks, whereas lower confidence scores show a strong tendency to overvalue by 4-7%.
  • Avg Absolute Variance [5] of 4.4% shows fairly tight (precise) valuations, whereas the other buckets are all double-digits.
  • PPE10 [6] of 90% means that 90% of “high” confidence score valuations are within +/- 10%. Other confidence buckets range from 67% to even below 50%.
  • PPE>20 [7] measures excessive overvaluations (greater than 20%), which can create very high-risk situations for lenders. In the “high” confidence bucket, they are almost nonexistent at 1.8%, but in other buckets they are 13%, 28% or even 31.6%.

This last metric mentioned is instructive. Model 1 is a very-high-performing AVM. However, in a certain small segment (about 3%), acknowledged by very low confidence scores, the model has a tendency to over-value properties by 20% or more almost one-third of the time.

The good news is that the model warns users of the diminished accuracy of certain estimates, but it’s up to the user to realize when to disregard those valuations. A close look at the table shows that with different models, there are different cut-offs that might be appropriate. Not every user’s risk appetite is the same, but we’ve highlighted certain buckets that might be deemed acceptable.

Model 2 and Model 5, for example, have very different profiles. Whereas Model 1 produced a majority of valuations with a “high” confidence level, Model 2 and Model 5 put very few valuations into that category. “Confidence scores” don’t have a fixed method of calculation that is standardized between Models. It’s possible that Model 2 and Model 5 use their labels more conservatively. That’s one more reason that users should test the models that they use and not simply expect them to perform similarly and use labels consistently.

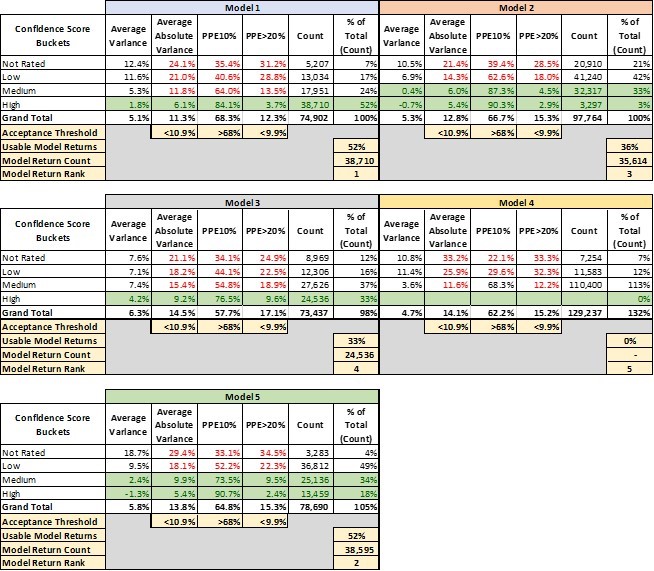
That leads into a third conclusion that leaps out of this analysis. There’s a huge advantage to having access to multiple models and the ability to pick and choose between them. It’s not immediately apparent from this analysis, but these models are not all valuing the same properties with “high” confidence (this will be analyzed in two follow-up papers in this series). Model 4 is our top-ranked model overall. However, as shown in Table 2, there are tens of thousands of benchmarks that Model 4 valued with only “medium” or “low” or even “not rated” confidence but for which Model 1 had “high” confidence valuations.

Table 2 The same Q1 2020 comparison against benchmarks, but we removed the benchmarks for which Model 4 had “high” confidence in its valuations leaving a sample size of 129,237 for the other models to value

Different models have strengths in different geographic areas, with different property types or even in different price ranges. The ideal situation is to have several layers of backups, so that if your #1 model struggles with a property and produces a “low” confidence valuation, you have the ability to turn to a second or third model to see if they have a better estimate. This last point is the purpose of Model Preference Tables®. They specify which model ranks first second and third across every geography, property type and price tranche.  And, users may find that some models are only valuable as a second or third choice in some regions, but by adding them to the panel, the user can avoid that dismal dilemma: “Do I use this valuation that I expect is awful – what other choice do I have?”


[1] We grouped valuations as follows: <70% were considered “not rated,” 70-80% were considered “low,” 80-90% “medium,” and 90+ “high.”

[2] In fact, this isn’t wrong in some cases. For example, in the case of Model 2, the “medium” and “high” confidence valuations don’t differ significantly.

[3] The correlation coefficient indicates the strength of the relationship between two variables can be found using the following formula:

Where:

  • rxy – the correlation coefficient of the linear relationship between the variables x and y
  • x– the values of the x-variable in a sample
  •  – the mean of the values of the x-variable
  • yi – the values of the y-variable in a sample
  • ȳ – the mean of the values of the y-variable

[4] Mean Error (ME)

[5] Mean Absolute Error (MAE)

[6] Percentage Predicted Error within +/- 10%

[7] Percentage Predicted Error greater than 20%, aka Right Tail Error

An Interview with Lee Kennedy: Trends, the Future, and Regulation

The AVMNews sat down with our publisher Lee Kennedy to discuss trends in the industry.

AVMNews: Lee, as the Managing Director at AVMetrics, you’re sitting at the center of the Automated Valuation Model (AVM) industry. What changes have you seen recently?

Lee: There’s a lot going on. We see firsthand how the evolution of the technology has affected the sector dramatically. The availability of data and the decline in costs of storage and computing power have opened the doors to new competition. We see new entrants using new techniques and built by fresh faces. We still have a number of large players offering well-established AVMs. But, we also see the larger players retiring some of their older models. The established AVM players have responded in some cases by raising their game, and in other cases, by buying their upstart rivals. So, we’ve seen increased competition and increased consolidation at the same time.

And, it’s true that the tools keep getting better. It’s not evenly distributed, but on average they continue to do a better and better job.

AVMNews: In what ways do AVMs continue to get better?

Lee: AVMetrics has been conducting contemporaneous AVM testing for over a decade now, and we have many quantitative metrics showing how much better AVMs are getting. Specifically, we run statistical analysis around the comparison of AVM estimates to sales prices that are unknown to the models. We have seen increases in model accuracy rates measured by percentage of predicted error (PPE), mean absolute error (MAE) and a host of other metrics. Models are getting better at predicting sale prices and when they miss, they don’t miss by as much as they used to.

AVMNews: What about on the regulatory side?

Lee: There is always a lot going on. The regulatory environment has eased in the last two years reflecting a whole new attitude in Washington, D.C. – one that is more open to input and more interested in streamlining. Take, for instance, the 2018 Treasury report that focuses on advancing technologies (See “A Financial System That Creates Economic Opportunities”).

Last November, I was at a key stakeholder forum for the Appraisal Subcommittee (ASC). One area of focus was harmonizing appraisal requirements across agencies. Another major focus was how to effectively employ new tools in support of the appraisal industry, including the growth of Alternative Valuation Products that utilize AVMs.

AVMNews: I know that you also wrote a letter to the Federal Finance Institutions Examination Council (FFIEC) about raising the de minimis threshold, below which some lending guidelines would NOT require an appraisal.  This year in July they elected to change the de minimus threshold from $250,000 to $400,000 for residential housing. What are your thoughts?

Lee: Well, I think that the question everyone is struggling with is “What does the future hold for appraisers and AVMs?” Obviously, the field of appraisers is shrinking, and AVMs are economical, faster and improving. How is this going to play out?

First, my strong feeling is that appraisers are a valuable and limited resource, and we need to employ them at their highest and best use. Trying to be a “manual AVM” is not their highest and best use. Their expertise should be focused on the qualitative aspects of the valuation process such as condition, market and locational influences, not the quantitative (facts) such as bed and bath counts. Models do not capture and analyze the qualitative aspects of a property very well.

Several companies are developing ways of merging the robust data processing capabilities of an AVM with the qualitative assessment skills of appraisers.  Today, these products typically use an AVM at their core and then satisfy additional FFIEC evaluation criteria (physical property condition, market and location influences) with an additional service.  For example, the lender can wrap a Property Condition Report (PCR) around the AVM and reconcile that data in support of a Home Equity Line of Credit (HELOC) lending decision.  This type of hybrid product offering is on the track that we’re headed down.  Many AMCs and software developers have already created these types of products for proprietary use or for use on multiple platforms.

AVMNews: AVMs were supposed to take over the world. Can you tell us what happened?

Lee: Well, the Financial Crisis is one thing that happened. Lawsuits ensued, and everyone got a lot more conservative. And, the success of AVMs developed into hype that was obviously unrealistic. But, AVMs are starting to gain traction again. We are answering a lot more calls from lenders who want help implementing AVMs in their origination processes. They typically need our help with policies and procedures to stay on the right side of the Office of the Comptroller of the Currency (OCC) regulations, and so in the last year, we’ve done training at several banks.

Everyone is quick to point out that AVMs are not infallible, but AVMs are pretty incredible tools when you consider their speed, accuracy, cost and scalability. And, they are getting more impressive. Behind the curtain the models are using neural networks and machine learning algorithms. Some use creative techniques to adjust prices conditionally in response to situational or temporary conditions. We test them and talk to their developers, and we can see how that creativity translates into improved performance.

AVMNews: You consult to litigants about the use of AVMs in lawsuits. How do you think legal decisions and risk will affect the use of AVMs?

Lee: This is an area of our business, litigation support, where I am restricted from saying very much. It has been and continues to be an enlightening experience as some of the best minds are involved in all aspects of collateral valuation and the “Experts” are truly that… experts in their fields as econometricians, statisticians, appraisers, modelers, etc.… It is also very interesting with over 50 cases behind us now, to get a look behind the legal system curtain and how all of that works. Therefore, I want to emphasize that my comments for our interview are in the context of contemporaneous AVMs that were tested during the time period shown here and not a retrospective AVM that was looking back to these time periods.

AVMNews: AVMetrics now publishes the AVM News – how did that come about?

Lee: As you and the many subscribers know, Perry Minus of Wells Fargo started that publication as a labor of love over a decade ago. When he retired recently, he asked if I would take over as the publisher. We were honored to be trusted with his creation, and we see it as a way to be good citizens and contribute to the industry as a whole.

AVMNews: I encourage anyone interested in receiving the quarterly newsletter for free to go to http://eepurl.com/cni8Db


The AVMNews is a quarterly newsletter that is a compilation of interesting and noteworthy articles, news items and press releases that are relevant to the AVM industry. Published by AVMetrics, the AVMNews endeavors to educate the industry and share knowledge about Automated Valuation Models for the betterment of everyone involved.

Los Angeles Market Summary

Headline for Lynn Kennedy’s Market Summary

Lynn Kennedy, a contributing consultant at AV Metrics, provides us the Market Summary for Los Angeles County featured in Mobility Magazine, July 2019.  

http://www.nxtbook.com/ygsreprints/WERC/mobility_072019/index.php#/30

Learn more about Mobility Magazine, the magazine of the Worldwide ERC, dedicated to professionals involved in talent mobility. www.worldwideerc.org

AVM Regulatory Outlook

As always, changes are coming to the valuation industry. These changes have been germinating in government and industry for a long time, but they’ve made progress in the last year, and I believe that they’re likely to emerge sometime this year.  I expect that we may see more regulatory changes liberalizing the use of AVMs soon.

I think that you’ll come to that same conclusion, too, if I share a couple milestones that I’ve observed and put them together with some insights I’ve gathered from talking to industry leaders.

The first milestone I will highlight was the July 2018 Financial System report by Secretary Mnuchin, which is consistent with the administration’s new attitude towards regulation. The report is far-reaching, and it includes thoughtful commentary about the uses of AVMs (see, for example, page 103-106). It recommends updating FIRREA appraisal requirements to accommodate increased usage of AVMs and hybrids. It also advocates for increased monitoring of AVMs and the application of rigorous market standards. And, it recommends focusing the use of AVMs and hybrids on loan programs with other mitigating risk factors.

The next milestone I will highlight was the proposed change in the de minimis threshold that was put out for comment in November of last year. The change would raise the threshold below which a residential mortgage could be originated with an evaluation, utilizing an AVM in lieu of a traditional appraisal. It would be raised from $250,000 to $400,000.

To those milestones I would add a third data point.  Last November I attended the Appraisal Subcommittee roundtable entitled: “The Evolving Real Estate Valuation Landscape.” As part of the of the Federal Financial Institutions Examination Council, the roundtable brought together industry representatives and government officials (see the table below) to discuss real estate valuation.

The day was split into two sessions; the morning and afternoon sessions each began with a panel of industry experts who addressed a series of prepared questions. In addition, there was a roundtable discussion focused on quotes from the July 2018 Financial System report referenced above.

The topic for the morning discussion was “Harmonizing Real Estate Valuation Requirements Across the Federal Government.” This session focused on identifying various federal appraisal statutory and regulatory requirements and exploring opportunities to harmonize those requirements, e.g., VA, FHA, and FHFA all having differing valuation requirements and standards.

The afternoon panel discussion topic was; “The Evolution of Real Estate Valuation” which focused on evolving valuation needs in commercial and mortgage lending. A key area of this session was focused on Alternative Valuation Products inclusive of AVM’s and their increasing used by lenders and the secondary market.

The roundtable discussion started with quotes about AVMs and hybrid valuation products and focused on standards. The group also contemplated how alternative valuation techniques can impact quality and mitigate risk. Finally, one quote that focused on speeding the adoption of technology was discussed.

As I write this six months later, I see the pieces of the puzzle coming together. Obviously, there is momentum behind the increased usage of AVMs, for their independence, increasing accuracy, speed and efficiency. But there is also an implicit concern to avoid opening the door to more risk. I see this being expressed by talk about “standards,” alternative products, such as “hybrids” and increased monitoring.

As I have written elsewhere, I welcome changes that make better use of our valuable and limited resources, namely the appraisers themselves. As AVM quality improves and the number of appraisers shrinks, we should encourage appraisers to be focused on their highest and best use. Their expertise should be focused on the complex, qualitative aspects of property valuation such as the property condition and market and locational influences.  They should also be focused on performing complex valuation assignments in non-homogeneous markets. Trying to be a “manual AVM” is not the highest and best use of a highly qualified appraiser, and I expect that Treasury, the FDIC and legislators are moving in this same direction.

Lee Kennedy

Participants in “The Evolving Real Estate Valuation Landscape” Appraisal Subcommittee, Federal Financial Institutions Examination Council, 2018
GovernmentTrade OrganizationsIndustry Participants
The Appraisal Foundation (TAF)American Bankers AssociationAVMetrics, LLC
Association of Appraiser Regulatory Officials (AARO)American Society of AppraisersBank of America
Consumer Financial Protection Bureau (4)American Society of Farm Managers and Rural AppraisersClarocity Valuation Services
Federal Deposit Insurance Corporation(3)Appraisal InstituteClearBox
Federal Housing Finance Agency(4)Homeownership Preservation FoundationCoreLogic
Federal Reserve Board(5)Independent Community Bankers of AmericaCushman & Wakefield Global Services, Inc.
Freddie MacMortgage Bankers AssociationFarm Credit Mid-America
Internal Revenue ServiceNational Association of Home BuildersFirst American Mortgage Solutions
National Credit Union AdministrationNational Association of RealtorsGenworth Financial
Office of the Comptroller of the Currency (4)Real Estate Valuation Advocacy Association (REVAA)JPMorgan Chase & Company
Tennessee Real Estate Appraisers CommissionState appraiser coalitions representativeOld Line Bank
Texas Appraiser Licensing and Certification Board Quicken Loans
U.S. Department of Agriculture ServiceLink
U.S. Department of Justice (2)  
U.S. Department of the Interior (2)  
U.S. Department of Veterans Affairs  
US. Department of Housing and Urban Development  

The Proper Way to Select an AVM

After determining that a transaction or property is suitable for valuation by an Automated Valuation Model (AVM), the first decision one must make is “Which AVM to use?” There are many options – over 20 commercially available AVMs – significantly more than just a few years ago.  While cost and hit rate may be considerations, model accuracy is the ultimate goal. A few additional estimates that are off by more than 20 percent can seriously increase costs. Inaccuracy can increase second-looks, cause loans not to close at all or even stimulate defaults down the road.

Which is the best AVM?

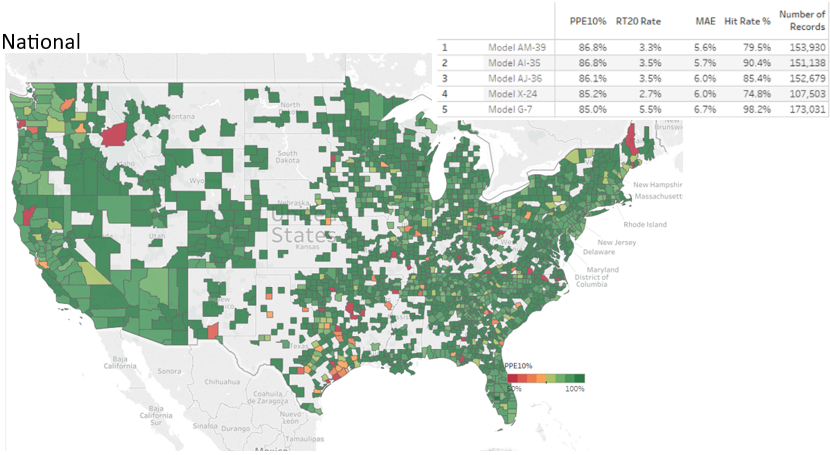
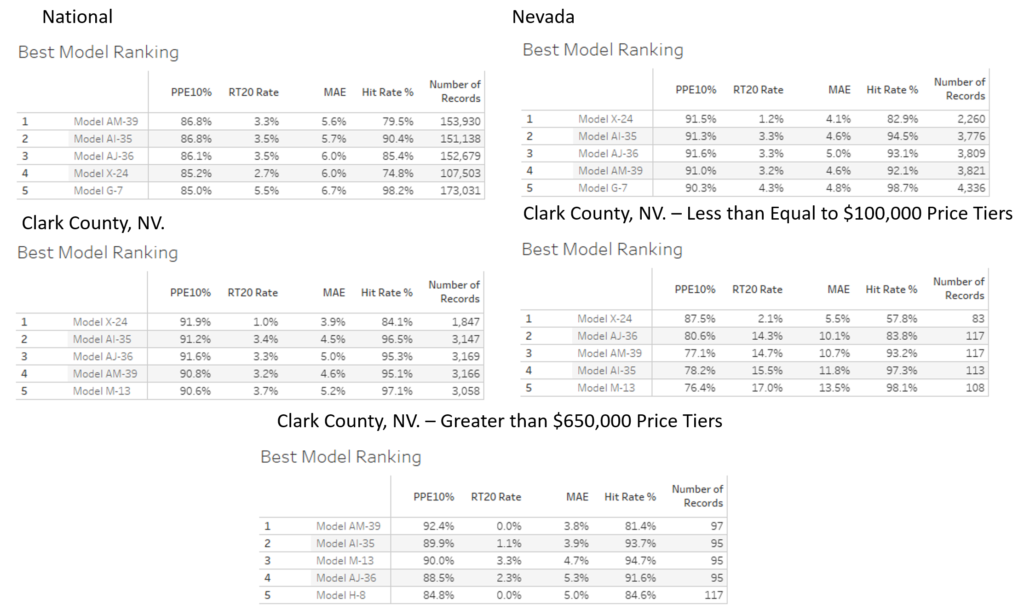
We test the majority of residential models currently available, and in the nationwide test in Figure #1 below, Model AM-39 (not its real name) was the top of the heap. It has the lowest average (absolute) error (MAE) by .1 over the 2nd place model.  Model AM-39 is a full percentage point better than the 5th ranked model, which is good, but that’s not everything. Model AM-39 has the highest percentage of estimates within +/- 10% (PPE10%). Model AM-39 has the 2nd lowest percentage of extreme overvaluations (>=20%, or RT20 Rate), an especially bad type of error indicating a significant overvaluation or Right Tailed error.

Figure 1: National AVM Ranking

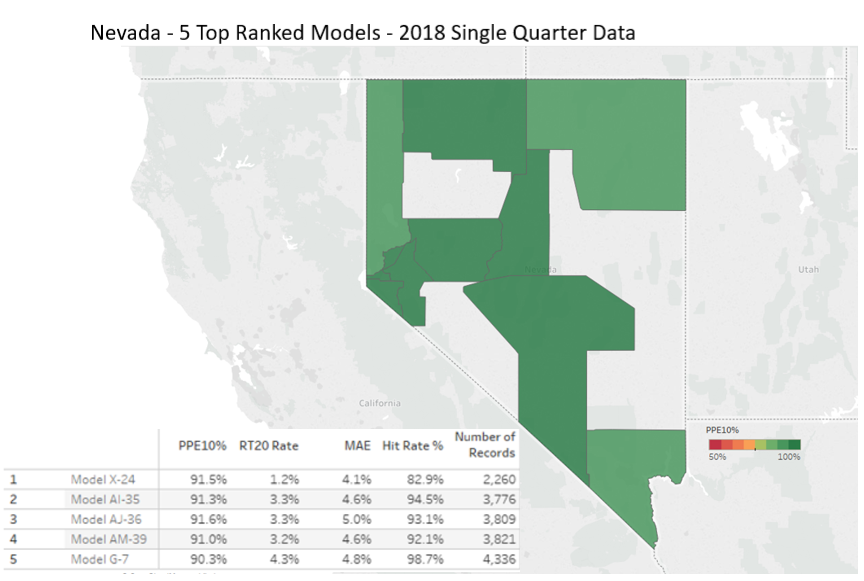
If you were shopping for an AVM, you might think that Model AM-39 is the obvious choice. This model performs at the top of the list in just about every measure, right? Well, not so fast. Consider that those measurements are based on testing AVM’s across the entire nation, and if you are only doing business in certain geographies, you might only care about which model or AVM is most accurate in those areas. Figure 2 shows a ranking of models in Nevada, and if your heart was set on Model AM-39, then you would be relieved to see that it is still in the top 5. And, in fact, it performs even better when limited to the State of Nevada. However, three models outperform Model AM-39, with Model X-24 leading the pack in accuracy (albeit with a lower Hit Rate).

Figure 2 Nevada AVM Rankings

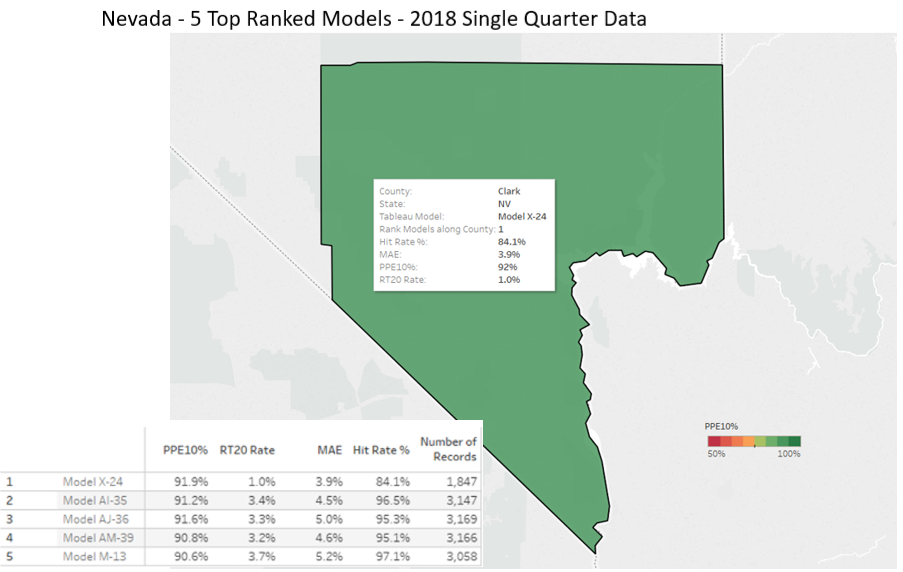
So, now you might be sold on Model X-24, but you might still look a little deeper. If, for example, you were a credit union in Clark County, you might focus on performance there. While Clark County is pretty diverse, it’s quite different from most other counties in Nevada. In this case, Figure 3 shows that the best model is still, Model X-24, and it performs very well at avoiding extreme overvaluations.

Figure 3 Clark County AVM Rankings

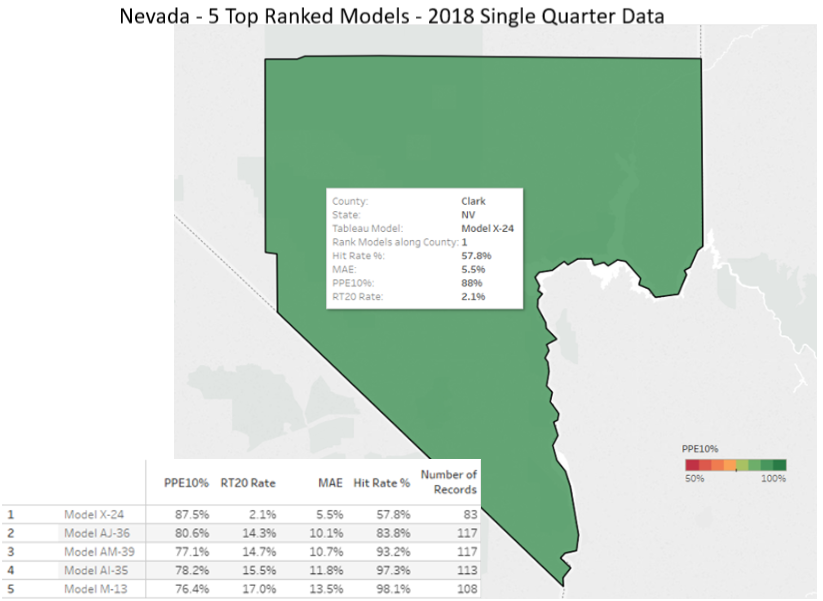
However, if your Clark County Credit Union is focused on entry level home loans with properties values below $100K, you might want to check just that segment of the market. Figure 4 shows that Model X-24 continues to be the best performer in Clark County for this price tier. Note that the other top models, including Model AM-39, show significant weaknesses as their overvaluation tendency climbs into the teens. This is not a slight difference, and it could be important. Model AM-39 is seven times more likely than Model X-24 to overvalue a property by 20%, and those are high-risk errors.

Figure 4 Clark County AVM Rankings, <$100K Price Tier

Look carefully at the model results in Figure 4 and you’ll see that Model X-24, while being the most accurate and precise, has the lowest hit rate. That means that about 40% of the time, it does not return a value estimate. The implication is: you really want a second and a third AVM option.

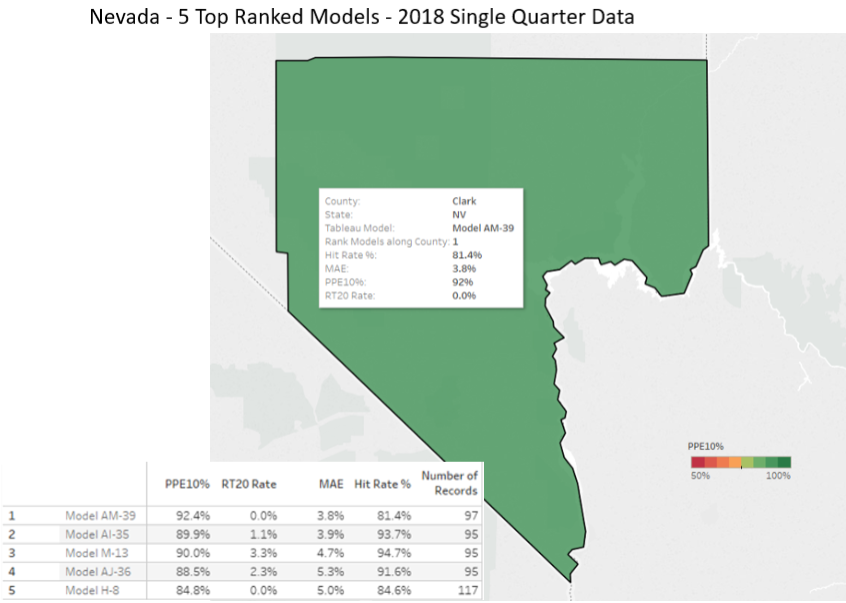
Now let’s consider a different lending pattern for the Clark County credit union. Consider a high value property lending program and look at figure 5, which is an analysis of the over-$650K properties and how the models perform in that price tier. Figure 5 shows that Model X-24 is no longer in the top five models. The best performer in Clark County for this price tier is Model AM-39, with 92% within +/-10% and zero overvaluation error in excess of 20%. The other models in the top five also do a good job of valuing properties in this tier.

Figure 5 Clark County AVM Ranking, >$650K Price Tier

Figure 6 summarizes this exercise, which demonstrates the proper thinking when selecting models. First, focus on the market segment that you do business in – don’t use the model that performs best outside your service area. Second, rather than using a single model, you should use several models prioritized into what we call a “Model Preference Table®” in which models are ranked #1, #2, #3 for every segment of your market. Then, as you need to request an evaluation, the system should call the AVM in the #1 spot, and if it doesn’t get an answer, try the next model(s) if available.

Figure 6 Summary of AVM Rankings

In this way, you get the most competent model for the job. Even though one model will test better overall, it won’t be the best model everywhere and for every property type and price range.  In our example, the #1 model in the nation was not the preferred model in every market segment we focused on. If we had focused on another geography or market segment, we almost certainly would have seen a reordering of the rankings and possibly even different models showing up in the top 5. The next quarter’s results might be different as well, because all the models’ developers are constantly recalibrating their algorithms; inputs and conditions are changing, and no one can afford to stand still.

AVMs Keep Getting Better, Craig Gilbert Noticed

For more than 12 years we’ve been testing AVMs and watching them improve over time. More model builders have developed better techniques, and with the falling cost of processing and storage, and with the improving availability of data, AVMs just continue to get better and better.

We aren’t the only ones noticing. We recently read with pleasure Craig Gilbert’s observations of the same phenomenon (Craig is an expert appraiser and co-founder of RAC – Relocation Appraisers and Consultants).

Since co-developing the AVM for Veros in 1999+, I’ve been predicting that AVMs would eventually morph over from Mortgage Origination & Portfolio Valuations, the primary intended uses, into Relocation buyouts. The question has been “when”, not “if”.  Relocation represents a microcosm sub-market of the overall residential appraisal business – maybe 5% of the total?

Back in the early days, AVMs were not as accurate as they are today. This has changed. I was thinking about this very thing this morning before opening the current issue of Mobility Magazine, and there it was. The time has arrived.

Read Mobility Magazine December 2018 article “TECHNOLOGY TODAY – What’s Hot for Mobility” written by Steven M. John and Mary-Grace Ellington of HomeServices Relocation.

Here are a few excerpts from the article:

– Recent experiments to test reliability of AVMs show the results to be comparable to formal, in-person appraisals.”

– These valuation tools can save significant time and money while offering convenience.”

– A typical FAVM can be obtained for a fraction of the cost of a traditional appraisal.”  [“F” = Forecasting]

– Target values are not fed into the models, and they are not subject to obvious human bias, so theirs perceived impartiality”

– Fidelity Residential Solutions has been at the forefront of testing these new tools.”

Other Resources

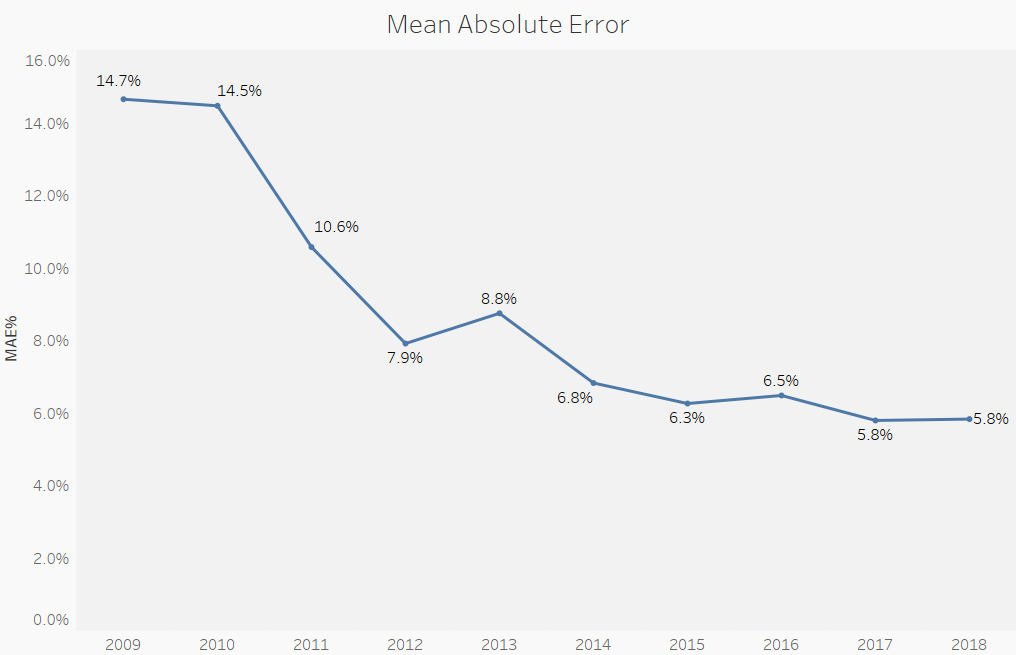
Some of you may know Lee Kennedy, an Independent AVM Expert, of AVMetrics, started by Lee in 2005. Lee is a really great guy, has been an appraiser since the mid-80’s, has testified as an expert witness on cases involving use of AVMs and the Financial Crisis and has spoken at recent A.I. Symposium. He’s like the AVM gate-keeper. In his blog titled “The Wild, Wild West of Automated Valuations”, there is a graph showing that the mean absolute error of tested AVMs decreased from 14.7% in 2009 to 5.8% in 2017 and 2018. This is for all AVMs in entire U.S..  Some of course are more accurate than a +-5.7% error rate, when drilling down to specific neighborhoods and AVMs, on a case-by-case basis.

The Wild, Wild West of Automated Valuations

Recently the OCC, FDIC and the Federal Reserve proposed raising the de minimis threshold for residential properties below which appraisals are not required to complete a home loan. Currently, most homes transacting at $250K and above require an appraisal, but Federal regulators propose to raise that level to $400K. A November 30th Wall Street Journal article raises some interesting issues about the topic. They reported that the number of appraisers is down 21% since the housing crisis, but more homes require an appraiser, since more and more homes exceed the threshold each year. The article also states that these factors open the door for cheaper, faster and “largely untested” property valuations based on computer algorithms, also known as Automated Valuation Models (AVMS).

At AVMetrics, we have been continuously testing AVMs for over 15 years, so we’ve seen how they’ve performed over time. As an example, the accompanying chart shows model performance accuracy as measured by mean absolute error, a statistical metric of valuation error.  We utilize many statistical measures of evaluating model accuracy and precision, and they all show significant improvement in AVMs over time. And, as these automated tools get better and the workforce of appraisers continues to shrink, the FFIEC members’ proposed change seems warranted, but that doesn’t mean they don’t have their critics.

Mean Absolute Error of all tested AVM models for the last 10 years

Ratish Bansal of Appraisal Inc was quoted in The Journal describing the state of AVMs as “a wild, wild West,” inviting, “abuse of all kind.” Furthermore, he contrasts that with the voluminous regulatory standards covering the use of appraisals.

We note much of those voluminous standards represent nearly the same quality control that was in place before the Credit Crisis.  In other words, appraisals are not a guarantee against collateral risk.  They are simply one tool in the toolbox – an effective, but comparatively time consuming and expensive tool. Also of note, far from being the “wild, wild west,” AVMs are also governed by regulators, most notably, Appendix B of the Appraisal and Evaluation Guidelines (OOC 2010-42) and Model Risk Management guidance (OCC 2011-12). These regulatory guidelines require that AVM developers be qualified, users of AVMs use robust controls, incentives be appropriate, and models be tested regularly and thoroughly with out-of-sample benchmarks. They require documentation of risk assessments and stipulate that a Board of Directors must oversee the use of all models. In other words, if AVMs were the “the wild, wild west” they would be rooted in a town with oversight of the legendary Wyatt Earp.

My strong feeling is that appraisals should not be a sole and exclusive tool when evaluations can be effectively employed in appropriate, lower-risk scenarios. Appraisers are a valuable and limited resource, and they should be employed at (to use appraisal terminology) their highest and best use.  Trying to be a “manual AVM” is not the highest and best use of a highly qualified appraiser.  Their expertise should be focused on the qualitative aspects of property valuation such as the property condition and market and locational influences. They should also be focused on performing complex valuation assignments in non-homogeneous markets.  AVMs do not capture and analyze the qualitative aspects of a property very well, and they still stumble in markets with highly diverse house stock or houses with less quantifiable attributes such as view properties.

However, several companies are developing ways of merging the robust data processing capabilities of an AVM with the qualitative assessment skills of appraisers.  Today, these products typically use an AVM at their core and then satisfy additionally required evaluation criteria (physical property condition, market and location influences) with an additional service.  For example, a lender can wrap a Property Condition Report (PCR) around the AVM and reconcile that data in support of a lending decision.  This type of “Hybrid valuation” is on the track we’re headed down.  Many companies have already created these types of products for commercial and proprietary use.

We at AVMetrics believe in using the right tool for the job, and we believe there is a place for automated valuations in prudent lending practices. We think the smarter approach would be to marginally raise the de minimis threshold, but simultaneously to provide additional guidance for considering other aspects of a lending decision, specifically, collateral considerations and eligibility criteria for appraisal exemptions such neighborhood homogeneity, property conformity, market conditions and more.

Cascade vs Model Preference Table® – What’s the Difference?

In the AVM world, there is a bit of confusion about what exactly is a “cascade.” It’s time to clear that up.  Over the years, the terms “cascade” and “Model Preference Table®” have been used interchangeably, but at AVMetrics, we draw an important distinction that the industry would do well to adopt as a standard.

In the beginning, as AVM users contemplated which of several available models to use, they hit on the idea of starting with the preferred model, and if it failed to return a result, trying a second model, and then a third, etc.  This rather obvious sequential logic required a ranking, which was available from testing, and was designed to avoid “value shopping.”[1]  More sophisticated users ranked AVMs across many different niches, starting with geographical regions, typically counties.  Using a table, models were ranked across all regions, providing the necessary tool to allow a progression from primary AVM to secondary AVM and so on.

We use the term “Model Preference Table” for this straightforward ranking of AVMs, which can actually be fairly sophisticated if they are ranked within niches that include geography, property type and price range.

More sophisticated users realized that just because a model returned a value does not mean that they should use it.  Models typically deliver some form of confidence in the estimate, either in the form of a confidence score, reliability grade, a “forecasted standard deviation” (FSD) or similar measure derived through testing processes.  Based on these self-measuring outputs from the model, an AVM result can be accepted or rejected (based on testing results) in favor of the next AVM in the Model Preference Table.  This application reflects the merger of MPT rankings with decision logic, which in our terminology makes it a “cascade.”

CriteriaAVMMPT®Cascade“Custom” Cascade
Value EstimateXXXX
AVM RankingXXX
Logic + RankingXX
Risk Tolerance + Logic + RankingX


The final nuance is between a simple cascade and a “custom” cascade.  The former simply sets across-the-board risk/confidence limits and rejects value estimates when they fail to meet the standard.  For example, the builder of a simple cascade could choose to reject any value estimate with an FSD > 25%.  A “custom cascade” integrates the risk tolerances of the organization into the decision logic.  That might include lower FSD limits in certain regions or above certain property values, or it might reflect changing appetites for risk based on the application, e.g., HELOC lending decisions vs portfolio marketing applications.

We think that these terms represent significant differences that shouldn’t be ignored or conflated when discussing the application of AVMs.


Lee Kennedy, principal and founder of AVMetrics in 2005, has specialized in collateral valuation, AVM testing and related regulation for over three decades.  Over the years, AVMetrics has guided companies through regulatory challenges, helped them meet their AVM validation requirements, and commented on pending regulations. Lee is an author, speaker and expert witness on the testing and use of AVMs. Lee’s conviction is that independent, rigorous validation is the healthiest way to ensure that models serve their business purposes.

[1] OCC 2005-22 (and the 2010 Interagency Appraisal and Evaluation Guidelines) warn against “value shopping” by advising, “If several different valuation tools or AVMs are used for the same property, the institution should adhere to a policy for selecting the most reliable method, rather than the highest value.”

How AVMetrics Tests AVMs

Testing an AVM’s accuracy can actually be quite tricky.  It is easy to get an AVM estimate of value, and you can certainly accept that a fair sale on the open market is the benchmark against which to compare the AVM estimate, but that is really just the starting point.

There are four keys to fair and effective AVM testing, and applying all four can be challenging for many organizations.

  1. Your raw data must be cleaned up, to ensure that there aren’t any “unusable” or “discrepant” characters in the data; differences such as “No.” “#” and “Num,” must be normalized.
  2. Once your test data is “scrubbed clean” it must be assembled in a universal format and it must be large enough to provide reliable test results, even down to the segment level for each property type within each price level within each county, etc. and this might require hundreds of thousands of records. 
  3. Timing must be managed so that each model receives the same sample data at the same time with the same response deadline.
  4. Last, and most difficult, the benchmark sales data must not be available to the models being tested.  In other words, if the model has access to the very recent sales price, it will be able to provide a near-perfect estimate by simply estimating that the value hasn’t changed (or changed very little) in the days or weeks since the sale. 

AVMetrics tests every commercially available AVM continuously and aggregates this testing into a report quarterly; AVMetrics’ testing process meets these criteria and many more, providing a truly objective measure of AVM performance. 

The process starts with the identification of an appropriate sample of properties for which benchmark values have very recently been established.  These are the actual sales prices for arm’s-length transactions between willing buyers and sellers—the best and most reliable indicator of market value.  To properly conduct a “blind” test, these benchmark values must be unavailable or “unknown” to the vendors testing their model(s).  AVMetrics provides in excess of a half million test records annually to AVM vendors (without information as to their benchmark values).  The AVM vendors receive the records simultaneously, run these properties through their model(s) and return the predicted value of each property within 48 hours, along with a number of other model-specific outputs.  These outputs are received by AVMetrics, where the results are evaluated against the benchmark values.  A number of controls are used to ensure fairness, including the following:

  • ensuring that each AVM vendor receives the exact same property list (so no model has any advantage)
  • ensuring that each AVM is given the exact same parameters (since many allow input parameters that can affect the final valuation)
  • ensuring through multiple checks that no model had access the recent sale data, which would provide an unfair advantage

In addition to quantitative testing, AVMetrics circulates a comprehensive vendor questionnaire twice annually.  Vendors that wish to participate in the testing process complete, for each model being tested, roughly 100 parameter, data, methodology, staffing and internal testing questions.  These enable AVMetrics, and more importantly our clients, to understand model differences within both testing and production contexts, and it enables us and our clients to satisfy certain regulatory requirements describing the evaluation and selection of models (see OCC 2010-42).

AVMetrics next performs a variety of statistical analyses on the results, breaking down each individual market, each price range, and each property type, and develops results which characterize each model’s success in terms of precision, usability and accuracy.  AVMetrics analyzes trends at the global, market and individual model levels, identifying where there are strengths and weaknesses, and improvements or declines in performance.

The last step in the process is for AVMetrics to provide an anonymized comprehensive comparative analysis for each model vendor, showing where their models stack up against all of the models in the test; this invaluable information facilitates the continuous improvement of each vendor’s model offerings.