Author: AVMetrics

#1 AVM in Each County Updated for Q3 2024

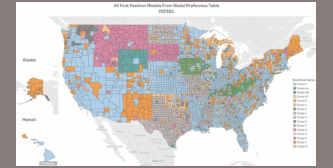
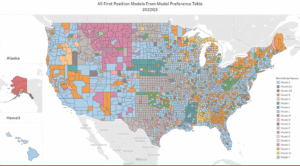
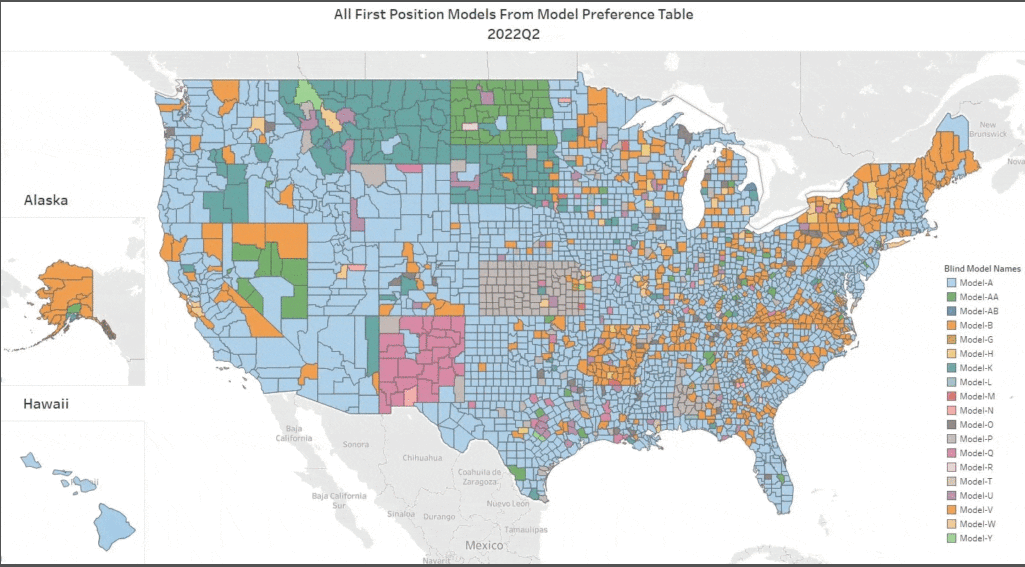
Every quarter we analyze all the top independently tested AVMs and compile the results. Click on this GIF to see the top AVM in each county for each quarter. As you watch the quarters change, you can see that the colors representing the top honors change frequently.

The main point is how frequently AVM performance changes. That should be no surprise, since market conditions change, and AVM’s have different strengths and tendencies. In Q3, AVMetrics independently tested 24 models; however, the GIF only highlights the 13 models that ranked in the top position of the MPTs. At least 11 AVMs shouldn’t be anyone’s first choice ANYWHERE, but they still have customers, presumably customers who don’t know the real performance of their AVMs. AVM Vendors and resellers are not Independent referees.

Independent testing is the only way to know how AVMs perform. This past quarter we saw several models retire while whole new models were introduced. Every model is constantly being improved as builders add new data feeds and use new techniques to get better results (with respect to new techniques, over at the AVMNews, we curate articles about AVMs, and we highlight several dozen new research articles about AVMs every year).

Q3 Change Highlights- Quarterly Trends Across the Coast 

As ever, if you watch a part of the map, you’ll see several changes. But, in Q3, as markets stabilized at higher interest rate levels, we saw a changing of the guard. Here are some places to watch:

  1. In the Golden State, one of the highest priority counties in state has a new king, Los Angeles.  Inyo, Imperial, King, and Tulare counties also changes hands (just to name a few).
  2. Several less-populated states had almost wholesale changes, such as the Dakotas, Alaksa, Montana, Wyoming, Nebraska, Oklahoma and Kansas.
  3. In the Sunshine State models were able to value several smaller counties that were not captured by models in Q2 including Collier, Columbia,  Okeechobee, Suwannee, and Union. 

Takeaways

Things change – a lot. Don’t rely on the results from last year or earlier this year. Heck, you can’t even trust last quarter! Often, 3 months’ of data are required to get a large enough sample in smaller regions, but we can slice it every way imaginable.

Use more than one AVM. It’s not obvious from a map showing just one AVM in each county, but if you think about what’s going on to produce these results, you’ll realize that AVMs have different strengths and there are a lot of them climbing all over each other to get to the top of the ranking. So, when you’re valuing a particular property, you just don’t know if it will be a good candidate for even the best AVM. When that AVM produces a result with low confidence, there’s a very good chance that another AVM will produce a reasonable estimate.

Use the right AVM for each use case and keep testing, because things change a lot and often.

AVMs React to New Final AVM Rules

On August 16th, Jon Wierks from First American penned an article about how First American is reacting to the new AVM Final Ruling. The article made several interesting points:

1. First American has specifically enhanced its AVM, their testing, and some of their tools in anticipation of the new rules. For example, FA has invested in explainable AI (xAI) in order to address fairness concerns.

Newer AVMs, like our Procision AVM Suite, were designed to comply with current AVM guidelines and in anticipation of the new guidelines. 

2. First American expects AVM users to be expected to take on their own testing responsibility, and this doesn’t just apply to banks.

…new guidelines, Quality Control Standards for Automated Valuation Models, requires mortgage originators and secondary market issuers “to maintain policies, practices, procedures, and control systems to ensure that automated valuation models used in these transactions adhere to quality control standards

3. AEI’s recent AVM study has drawn attention to the biggest issues with AVM testing, and our new testing techniques are advancing testing beyond any other innovation in a decade.

For several years, AVMetrics has been developing a blind testing system that it will roll out later this year. Rather than sending the same addresses to various providers each month and getting back their valuations, AVM providers will now value every property in the U.S. — more than 100 million valuations each month — and send this data to AVMetrics. The testing company will ingest this data and then blind test it against future sales and listing prices as they transact. As you would expect, this is a massive undertaking for AVM vendors and AVMetrics, but it will separate the AVMs that test well from those that actually perform well in real-world conditions.

Wierks’ conclusions are right on target with our beliefs that improving AVM accuracy, precision and confidence scoring are making them more useful to industry, and that appropriate testing is a prerequisite to their widespread adoption.


#1 AVM in Each County Updated for Q2 2024

Every quarter we analyze all the top AVMs and compile the results. Click on this GIF to see the top AVM in each county for each quarter. As you watch the quarters change, you can see that the colors representing the top honors change frequently.

The main point is how frequently AVM performance changes. That should be no surprise, since market conditions change and AVM’s have different strengths and tendencies. Phoenix has more tract housing, and some AVMs are optimized for that. Cities in the northeast have more row housing, and some models are better there. But AVMs also change – a lot. Whole new models are introduced, but every model is constantly being improved as builders add new data feeds and use new techniques to get better results (with respect to new techniques, over at the AVMNews, we curate articles about AVMs, and we highlight several hundred new research articles about AVMs every year).

Q2 Change Highlights

As ever, if you watch a part of the map, you’ll see several changes. In Q2, we saw a changing of the guard. Here are some places to watch:

  1. In Texas, most counties changed leadership. The counties that include Austin and its suburbs changed leadership. Not Dallas, but most of the counties around Dallas, and not Houston (Harris), but most of the counties around Harris County changed leadership.
  2. Much of Alaska, and the West Coast changed leadership.
  3. Some less-populated areas had almost wholesale changes, such as Colorado, Nevada, New Mexico, the Dakotas, rural Michigan, Illinois, Missouris, Arkansas, Louisiana, Mississippi and more.

Takeaways

  1. Things change – a lot. Don’t rely on the results from last year. Heck, you can’t even trust last quarter! We compile these results quarterly, but our testing is non-stop, and we can produce new optimizations monthly based on a rolling 3 months or any other time period. Often, 3 months’ of data are required to get a large enough sample in smaller regions, but we can slice it every way imaginable.
  2. Use more than one AVM. It’s not obvious from a map showing just one AVM in each county, but if you think about what’s going on to produce these results, you’ll realize that AVMs are climbing all over each other to get to the top of the ranking. So, when you’re valuing a particular property, you just don’t know if it will be a good candidate for even the best AVM. When that AVM produces a result with low confidence, there’s a very good chance that another AVM will produce a reasonable estimate. Why not be able to take three, four or five bites at the apple?

#1 AVM in Each County Updated for Q1 2024

Every quarter we analyze all the top AVMs and compile the results. Click on this GIF to see the top AVM in each county for each quarter. As you watch the quarters change, you can see that the colors representing the top honors change frequently.

GIF that depicts a changing map of the United States with colors representing the #1 AVM in each county. Each quarter, the colors change reflecting the changing #1 AVM. They change frequently and dramatically, demonstrating how dynamic AVM performance is.
Click the map to see how the #1 AVM in each county changes frequently.

The main point is how frequently AVM performance changes. That should be no surprise, since market conditions change and AVM’s have different strengths and tendencies. Phoenix has more tract housing, and some AVMs are optimized for that. Cities in the northeast have more row housing, and some models are better there. But AVMs also change – a lot. Whole new models are introduced, but every model is constantly being improved as builders add new data feeds and use new techniques to get better results (with respect to new techniques, over at the AVMNews, we curate articles about AVMs, and we highlight several hundred new research articles about AVMs every year).

Q1 Change Highlights

As ever, if you watch a part of the map, you’ll see several changes. In Q1, markets continued to grind along with higher interest rates. We saw a changing of the guard. Here are some places to watch:

  1. In Texas, most counties changed leadership. The counties that include Austin and its suburbs changed leadership. Not Dallas, but most of the counties around Dallas, and not Houston (Harris), but most of the counties around Harris County changed leadership.
  2. Much of rural California, Oregon and Washington changed leadership.
  3. Some less-populated areas had almost wholesale changes, such as Colorado, Nevada, New Mexico, the Dakotas, rural Michigan, Illinois, Missouris, Arkansas, Louisiana, Mississippi and more.

Takeaways

  1. Things change – a lot. Don’t rely on the results from last year. Heck, you can’t even trust last quarter! We compile these results quarterly, but our testing is non-stop, and we can produce new optimizations monthly based on a rolling 3 months or any other time period. Often, 3 months’ of data are required to get a large enough sample in smaller regions, but we can slice it every way imaginable.
  2. Use more than one AVM. It’s not obvious from a map showing just one AVM in each county, but if you think about what’s going on to produce these results, you’ll realize that AVMs are climbing all over each other to get to the top of the ranking. So, when you’re valuing a particular property, you just don’t know if it will be a good candidate for even the best AVM. When that AVM produces a result with low confidence, there’s a very good chance that another AVM will produce a reasonable estimate. Why not be able to take three, four or five bites at the apple?

Why Mark Sennott’s Whitepaper Stopped Us Cold

At AVMetrics, we have to admit having mixed feelings about Mark Sennott’s recent whitepaper on AVMs. We’re quite grateful for his praise on our testing, which he describes as “robust, methodical and truly independent.” He echoes some of our key concerns:

  • AVMs perform very differently, so it is important to test before using
  • AVM performance changes more frequently than you’d think
  • Everyone should employ a cascade using multiple AVMs, because it dramatically increases the accuracy of the delivered results.

However, there was something quite disconcerting in Mark’s telling of how AVMs are being used. In Mark’s words:

In practice, however, the top performing AVMs, based on independent testing performed by companies like AVMetrics, are not always the ones being delivered to lenders. The reason: self-interest on the part of the AVM delivery platforms who also sell and promote their own AVMs.

This very troubling delta between posture and operating practice had to be confronted first-hand by one of the lenders for which I provide guidance. What at first blush appeared as a straightforward exercise for the lender in vetting a platform provider’s cascade against AVMetrics independent testing results, became a ponderous journey to overcome contractual headwinds against a simple assurance the provider would indeed provide the highest scoring AVM model per AVMetrics recommendations. This was not the first time I experienced this apparent conflict of interest.

Kudos to Mark for writing openly about a practice that many in the industry would probably prefer that he kept quiet about.

AVMetrics Responds to FHFA on New Appraisal Practices

FHFA, the oversight agency for Fannie Mae and Freddie Mac, published a Request for Input on December 28, 2020. The RFI covered Appraisal-Related Policies, Practices and Processes. AVMetrics put forth a response including several pages and several exhibits making the case for using AVMs responsibly and effectively in a Model Preference Table®. Here is the Executive Summary:

The lynchpin to many of the appraisal alternatives is an Automated Valuation Model, a subject which AVMetrics has studied assiduously and relentlessly for more than 15 years. We point out that even an excellent AVM can be improved by the use of a Model Preference Table. MPTs enable better accuracy, fewer “no hits” and fewer overvaluations.

We also suggest an escalated focus on AVM testing, and we use our own research and citations of OCC Interagency Guidelines to emphasize the importance of testing to effectively use AVMs. We suggest that an “FSD Analysis” like the one we describe reduces risk by avoiding higher risk circumstances for using an AVM.

We suggest that the implementation of a universal MPT by the Enterprises will improve the collateral tools available and reduce the risk of manipulation by lenders. We also believe that a universal MPT can help redeploy appraisers to their highest and best use: the qualitative aspects of appraisal work. Our suggestion is that the GSEs endeavor to make the increased use of AVMs a benefit to appraisers, increasing their value-added and bringing them along in the transition.

AVMetrics’ full response is available here: